Real Time Water Temperature Monitoring at Buoy C12
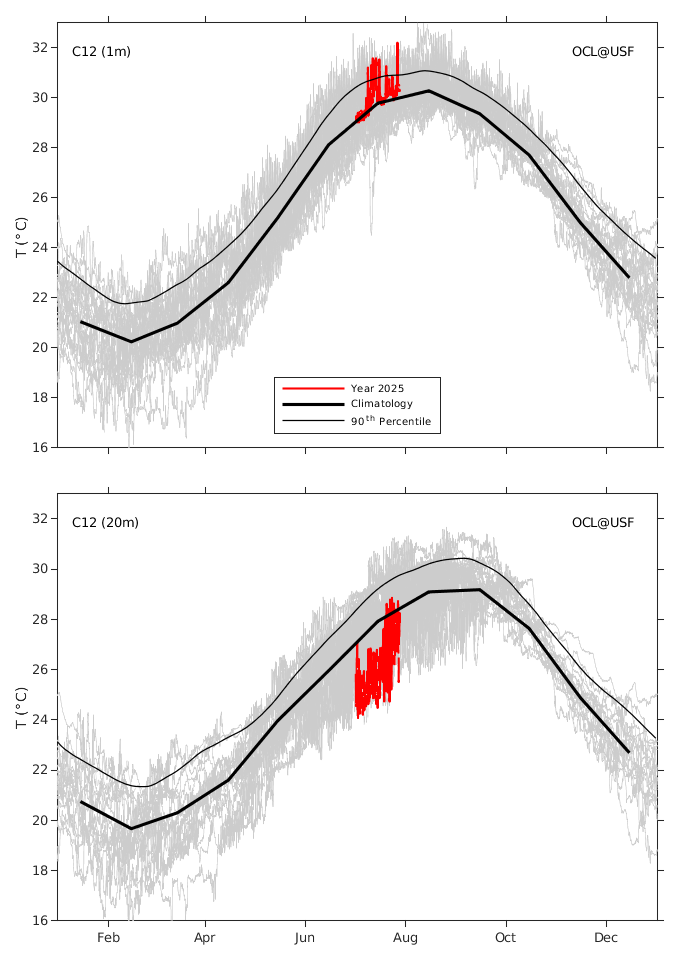
The real time water temperature data at Buoy C12 are shown (in red) along with their monthly mean climatology (thick black lines) and the 90th percentile (thin black lines), which are calculated from the long-term moored temperature data (shown as thin grey lines, one line per year for every year data was collected). The figures and calculations follow the convention in Liu et al. (2025). These subsurface temperature data provide important information on the ocean conditions and the available heat content that should be used for hurricane intensification forecasts.
Acknowledgements: The long-term moored observations on the West Florida Shelf have been supported through various external awards from the United States Geological Survey, the State of Florida, the Bureau of Ocean Energy Management, the Office of Naval Research, the National Oceanic and Atmospheric Administration, the National Aeronautics and Space Administration, the National Science Foundation, and the National Academies of Sciences Engineering and Medicine. Current support is primarily by Southeast Coastal Ocean Observing Regional Association (SECOORA) as a pass-through from NOAA IOOS, and supplemented by NOAA COMIT, NOAA NCCOS, State of Florida through FWC/FWRI, State of Florida Department of Environmental Protection, and Florida Flood Hub for Applied Research and Innovation. The moored observations are expanded to the northern West Florida Shelf with the funding from Florida Restore Act Center of Excellence (FLRACEP).
Disclaimer: The analyses/data are research products under development. No warranty is made, expressed or implied, regarding accuracy, or regarding the suitability for any particular application. All rights reserved: University of South Florida, College of Marine Science - Ocean Circulation Lab. Copyright, 2025.